




Turning on a module does not tell you whether the team is using it. For hotel groups, it also matters how that use compares across properties.
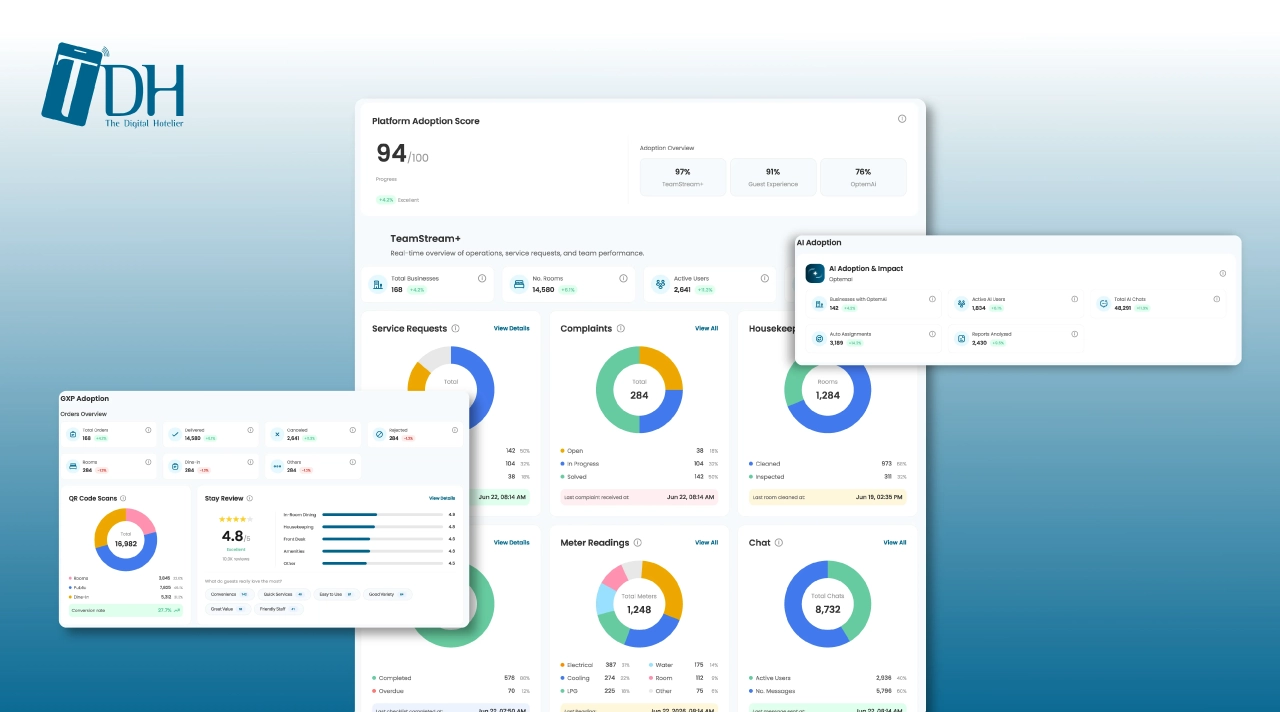
The Adoption Report is now live in TDH. It shows adoption across TeamStream+, Guest-Journey, and OptemAi, with product scores and the activity behind them.
See How Each Product Is Being Used
The report gives each hotel an overall adoption score out of 100, then breaks it down across the three TDH products.
For TeamStream+, you can review activity across operational areas, including service requests, complaints, housekeeping, checklists, meter readings, chat, notifications, training, and parking.
Guest-Journey shows activity across the guest experience, including orders by status and type, QR scans by source, conversion rate, stay review ratings and feedback, and which hotel services guests use.
OptemAi shows active users, how many chats they have run, which reports they have analyzed, and usage trends.
Each module card shows when its last action took place. Choose a date range to review operational activity for the period you want.
Understand What Makes Up a Score
Each module has a Configuration Score and an Operational Score. Configuration counts for 30% of the module’s score; operations counts for 70%.
The detail page shows the criteria behind each score. For example, the housekeeping configuration score checks whether housekeeping staff and cleaning types are set up, while its operational score measures activity such as daily logins and rooms cleaned.
The Configuration Score is calculated regardless of the selected date range. Operational activity is measured for the period you choose. If a module is fully configured but its Operational Score is low, the issue is day-to-day use, not setup.
| Score | Adoption Level |
| Below 40 | Very Low |
| 40 to 59 | Low |
| 60 to 74 | Moderate |
| 75 to 89 | High |
| 90 to 100 | Excellent |
Compare Hotels Across Your Group
The group view puts properties side by side, with each hotel’s room count, product scores, and total score. The score labels map to the TDH products as follows:
| Report Score | TDH Product |
| Ops Score | TeamStream+ |
| GXP Score | Guest-Journey |
| AI Adoption | OptemAi |
Compare scores across the group, then open a hotel to see the module details behind them. Independent hotels can use the same report to review their own product and module activity.
Find Your Adoption Report
Go to Dashboard > Reports > Adoption Report. Choose a date range, review the product scores, then open a module to see what makes up its score. The Operational Score lines show where to focus.
The report is live now and requires no setup. If you cannot find it or want to review a live score with your team, contact your account manager or email [email protected].
New to TDH? Book a demo to see the Adoption Report and the full TDH platform in action.